Back to events

Mobile Networking

Back to home

Esperia.

Introduction

Redesigned an enterprise data product with AI assistance, a unified platform that cut publishing time by 97%, enabled self serve 3x AI adoption, reduced support tickets by 68%, and improved documentation coverage from 6% to 71%.

Shipped

Lead Product Designer

4 months

Web - Enterprise SaaS

Security Platform

Project Overview

Esperia had spent four years building serious AI infrastructure, but data teams still operated across disconnected tools with no coherent layer tying the capabilities together. They lacked a unified workflow to create, configure, serve, and govern AI-powered data products leaving fragmented tooling, poor discoverability, and zero visibility into how data was consumed downstream.


The Approach

I designed the end-to-end UX for the AI Product Studio across 6 modules, built in a new component for the design system and AI interaction and embedded AI into the platform from sprint one, to a 6-step creation wizard, a persistent AI Expert chat, configurable Knowledge Agents, and interactive data lineage.

The outcome

All 6 product modules shipped on Esperia Platform ONE. AI chat adoption rose 3×, creation errors dropped 64%, and platform NPS climbed from +8 to +44 within six months.

6/6

Modules Shipped

↑3×

AI Chat Adoption

+44

Platform NPS

existing Research

Problems - Fill in the Gaps

‘’ I spend more time figuring out where the data lives than actually analysing it. It feels like archaeology, not analytics.’’


— VP Operations, Logistics enterprise client

01

Lack of common creation workflow

Building a data product meant jumping across separate tools and 14 steps for dataset registration, dashboards, ML models, and API config. Each step was disconnected,

02

AI was invisible to consumers

Non-technical stakeholders could view static dashboards but had no way to ask questions or get AI generated insights.

03

Zero data lineage visibility

There was no way to trace a product back to its source datasets and transformations, engineers had no view into downstream usage.

04

AI config was developer-only

Setting up a Knowledge Agent or Trained Model required engineering. Non-technical producers couldn't tune LLM parameters independently.

Constraints

These weren't preferences, they were hard constraints that shaped every major design decision. I documented all constraints in a shared "Design Brief" with assigned impact ratings before any wireframing began.


6 product modules, one design system - Every area built under a single component library with shared tokens and patterns.


Dev-ready output from day one - The Figma file structure mirrored the engineering squad structure, with no ambiguity in handoff.


Multi persona platform - Separate UX flows for Data Producer and Data Consumer, sharing one visual language.


AI configurability for non engineers - Knowledge Agent setup had to be comprehensible to data analysts, not just ML engineers.


API first serving - Every product configurable for API serving with column level control, no engineering required.


Interactive data lineage in the UI - Zoomable, schema-expandable, within a web platform.


Every AI response carries the mandatory accuracy disclaimer - A legal requirement on every AI surface.


Design Process

Every design decision traced back to a user interview, a usability test, or a platform metric. Four phases, Discovery to GA launch, shipped in 4 months.

01

PHASE 01 · DISCOVERY

User Research & Problem Framing

18 interviews with data producers and consumers, plus a legacy tooling audit, to map where trust broke down.

User Interviews

Heuristic Audit

Journey Mapping

Competitive Analysis

Support Tickets

02

PHASE 02 · DEFINITION

Information architecture & Navigation

Card sorting and tree testing (81% success) validated a 5-space IA so nothing was buried.

IA Design

Card Sorting

Tree Testing

User Flow Mapping

03

PHASE 03 · DESIGN & TEST

Design system, Iterative design + usability testing

Four rounds of moderated testing surfaced the AI-surface fires wizard length, persistent chat, exposed LLM controls.

High Fidelity Designs

Usability Testing

Iteration

04

PHASE 04 · SHIP & SCALE

Rollout across all modules

Three dev-review rounds and DEV-Ready docs. All 6 modules shipped, then two follow up iterations.

Dev Handoff

Accessibility

Key metrics evaluation

dISCOVERY

Research

Before designing, I synthesised existing signals from platform analytics, previous discovery sessions, and competitor analysis. This grounded design decisions rather than starting from intuition. Also used tools lIke JIRA, Whyser, Monday.com

18%

Data products with API serving

14 / 4 tools

Steps to publish (Legacy)

11%

Consumers attempting self-serve

6%

Products with lineage docs

+280% QoQ

“Can’t find dataset” tickets

+8

NPS (pre-redesign)

Understanding the User Group

18 user interviews across 3 personas - Data Producer, Data Consumer, Platform Admin at 6 enterprise clients spanning financial services, retail, logistics, and healthcare

THE BUILDER

Date Producer

Data analyst or engineer. Creates datasets, configures pipelines, trains models, builds dashboards. Needs a structured end to end creation flow that doesn't require jumping tools. Blocked by governance complexity, API setup.

The Stakeholder

Data Consumer

Business executive, product manager, operations lead. Views dashboards, wants to ask ad-hoc questions without waiting for analyst time. Needs: AI chat on dashboards, data freshness indicators, auto-generated reports.

The Operator

Platform Admin

Controls access, monitors consumption, manages governance policies. Needs lineage visibility, usage statistics (API tokens, interactions, consumer counts), and a clear data catalog with consistent metadata.

User Interview Findings

The user research team has conduct qualitative interviews to understand how people manage money and what prevents them from making better financial decisions.

Steep Technical Barrier

"I need to ask engineering for help every time. It takes 3 weeks just to get a simple data product created."

— Business Analyst

Time-Consuming Process

"It takes me 40+ hours to configure everything properly. Most of it is repetitive work that could be automated."

— Data Engineer

Configuration Complexity

"The UI has so many fields and options, I don't know where to start. I usually give up halfway through."

— Data Analyst

Error-Prone Workflows

"I make mistakes all the time and only find out after deployment. No validation or error prevention."

— Data Product Owner

Lack of Guidance

"There's no help when I get stuck. Documentation is technical and hard to understand."

— Product Manager

Limited Visibility

"I can't see the status of my data products or track usage. It's a black box after creation."

— Operations Manager

Heuristic Evaluation Findings

Evaluated the existing platform against Nielsen's 10 usability heuristics. Identified 47 issues across critical, high, medium, and low severity.

Critical

8 issues

Visibility of System Status

No progress indicators during data product creation. Users don't know if process is working or stuck.

Solution: Added step-by-step wizard with clear progress indicators and estimated time remaining for each phase.

Critical

6 issues

Error Prevention

No validation until final submission. Users make errors that only appear after 30+ minutes of configuration.

Solution: Implemented real-time validation with AI-powered error detection and prevention at each step.

High

12 issues

Help & Documentation

Documentation is technical and hard to find. No contextual help for complex fields.

Solution: Integrated AI Expert assistant providing contextual help, tooltips, and natural language guidance at every step.

High

9 issues

Recognition vs Recall

Users must remember complex configuration rules and field dependencies across multiple screens.

Solution: Smart field suggestions, auto-population based on context, and visual relationship indicators between fields.

Medium

8 issues

Aesthetic & Minimalist Design

Overwhelming amount of information and options displayed at once, causing cognitive overload.

Solution: Progressive disclosure pattern showing only relevant fields based on user selections and role.

Medium

4 issues

Consistency & Standards

Inconsistent terminology and UI patterns across different sections of the platform.

Solution: Developed unified design system with consistent components, language, and interaction patterns.

Competitive Analysis

Evaluated the existing platform against Nielsen's 10 usability heuristics. Identified 47 issues across critical, high, medium, and low severity.

definition

Information Architecture & Navigation

The full information architecture of Esperia Platform Unit — validated with card sorting and tree testing before any high-fidelity design began. Structure reflects how data flows, not how legacy tools were disconnected and lacked a cohesive workflow.

Esperia Platform Unit

Home

Platform Overview

Recent Products

Onboarding Checklist

AI Expert Chat

Data Products

LIST — All Products

CREATE — 6-step Wizard

DETAIL — Overview

DETAIL — Dashboard

DETAIL — API Docs

DELETE — Confirm

AI Expert Chat

Lineage Graph

Pipelines

LIST — Pipelines

CREATE — Pipeline

DETAIL — Status

Integrations Catalog

Integration Config

Sync Scheduling

DELETE

Transforms

LIST — All

CREATE — SQL/dbt

DETAIL — Run status

Dependency Tree

Version History

Output Preview

DELETE

Data Catalog

LIST — Browse

Search + Filter

DETAIL — Schema

Column Metadata

Dataset Tags

Freshness Status

Lineage Preview

Changes from Tree Testing

Validated the information architecture with 45 participants using tree testing to ensure users could find key features intuitively.


Merged "Pipelines" and "Integrations" into one space - Users consistently looked for them together.


Moved Knowledge Agents under Data Products rather than a top-level item — only ML personas expected it standalone.


Renamed governance labels to plain language after 40% mis-sorted the legacy terms.


Promoted Data Catalog to a primary space after low findability scores in round one.


Kept AI Expert global (top bar) — every persona expected it persistently available, not nested.


Solutions

Decisions on the Screen

Each screen represents a core design decision, not just a layout choice, but a resolution to a specific user frustration or business goal.

6 Steps, Split panel with contextual AI attachment

A split view interface combined the dashboard canvas with a contextual panel for widgets, trained models and AI chat, surfacing key model details without leaving the workflow. Reduced data product creation time by 60%,

Guided workflow with 6 steppers breaking complex data product creation into digestible steps with clear progress indicators showing completion status.

Producers could switch between Dashboard and API outputs from the same screen, replacing a fragmented 7 step process.

Persistent AI Expert Chat Panel

Always visible AI panel (not a drawer) drove 3× higher adoption than the hiddenpanel prototype. Contextual to the dashboard dataset.

Inline Widget and Trained Models panel eliminated a separate model attachment flow.

Knowledge Agent config with Live preview

Complex LLM settings were translated into guided controls with real-time preview, making AI configuration accessible to non technical users. API toggle and Public Access toggle give producers instant control over serving scope.

Large Language Model (LLM) parameters each with plain language guidance eliminated the top support ticket category post launch.

Live preview panel lets producers test before publishing with no engineering required.

Also provides suggested starter prompts to help and validate.

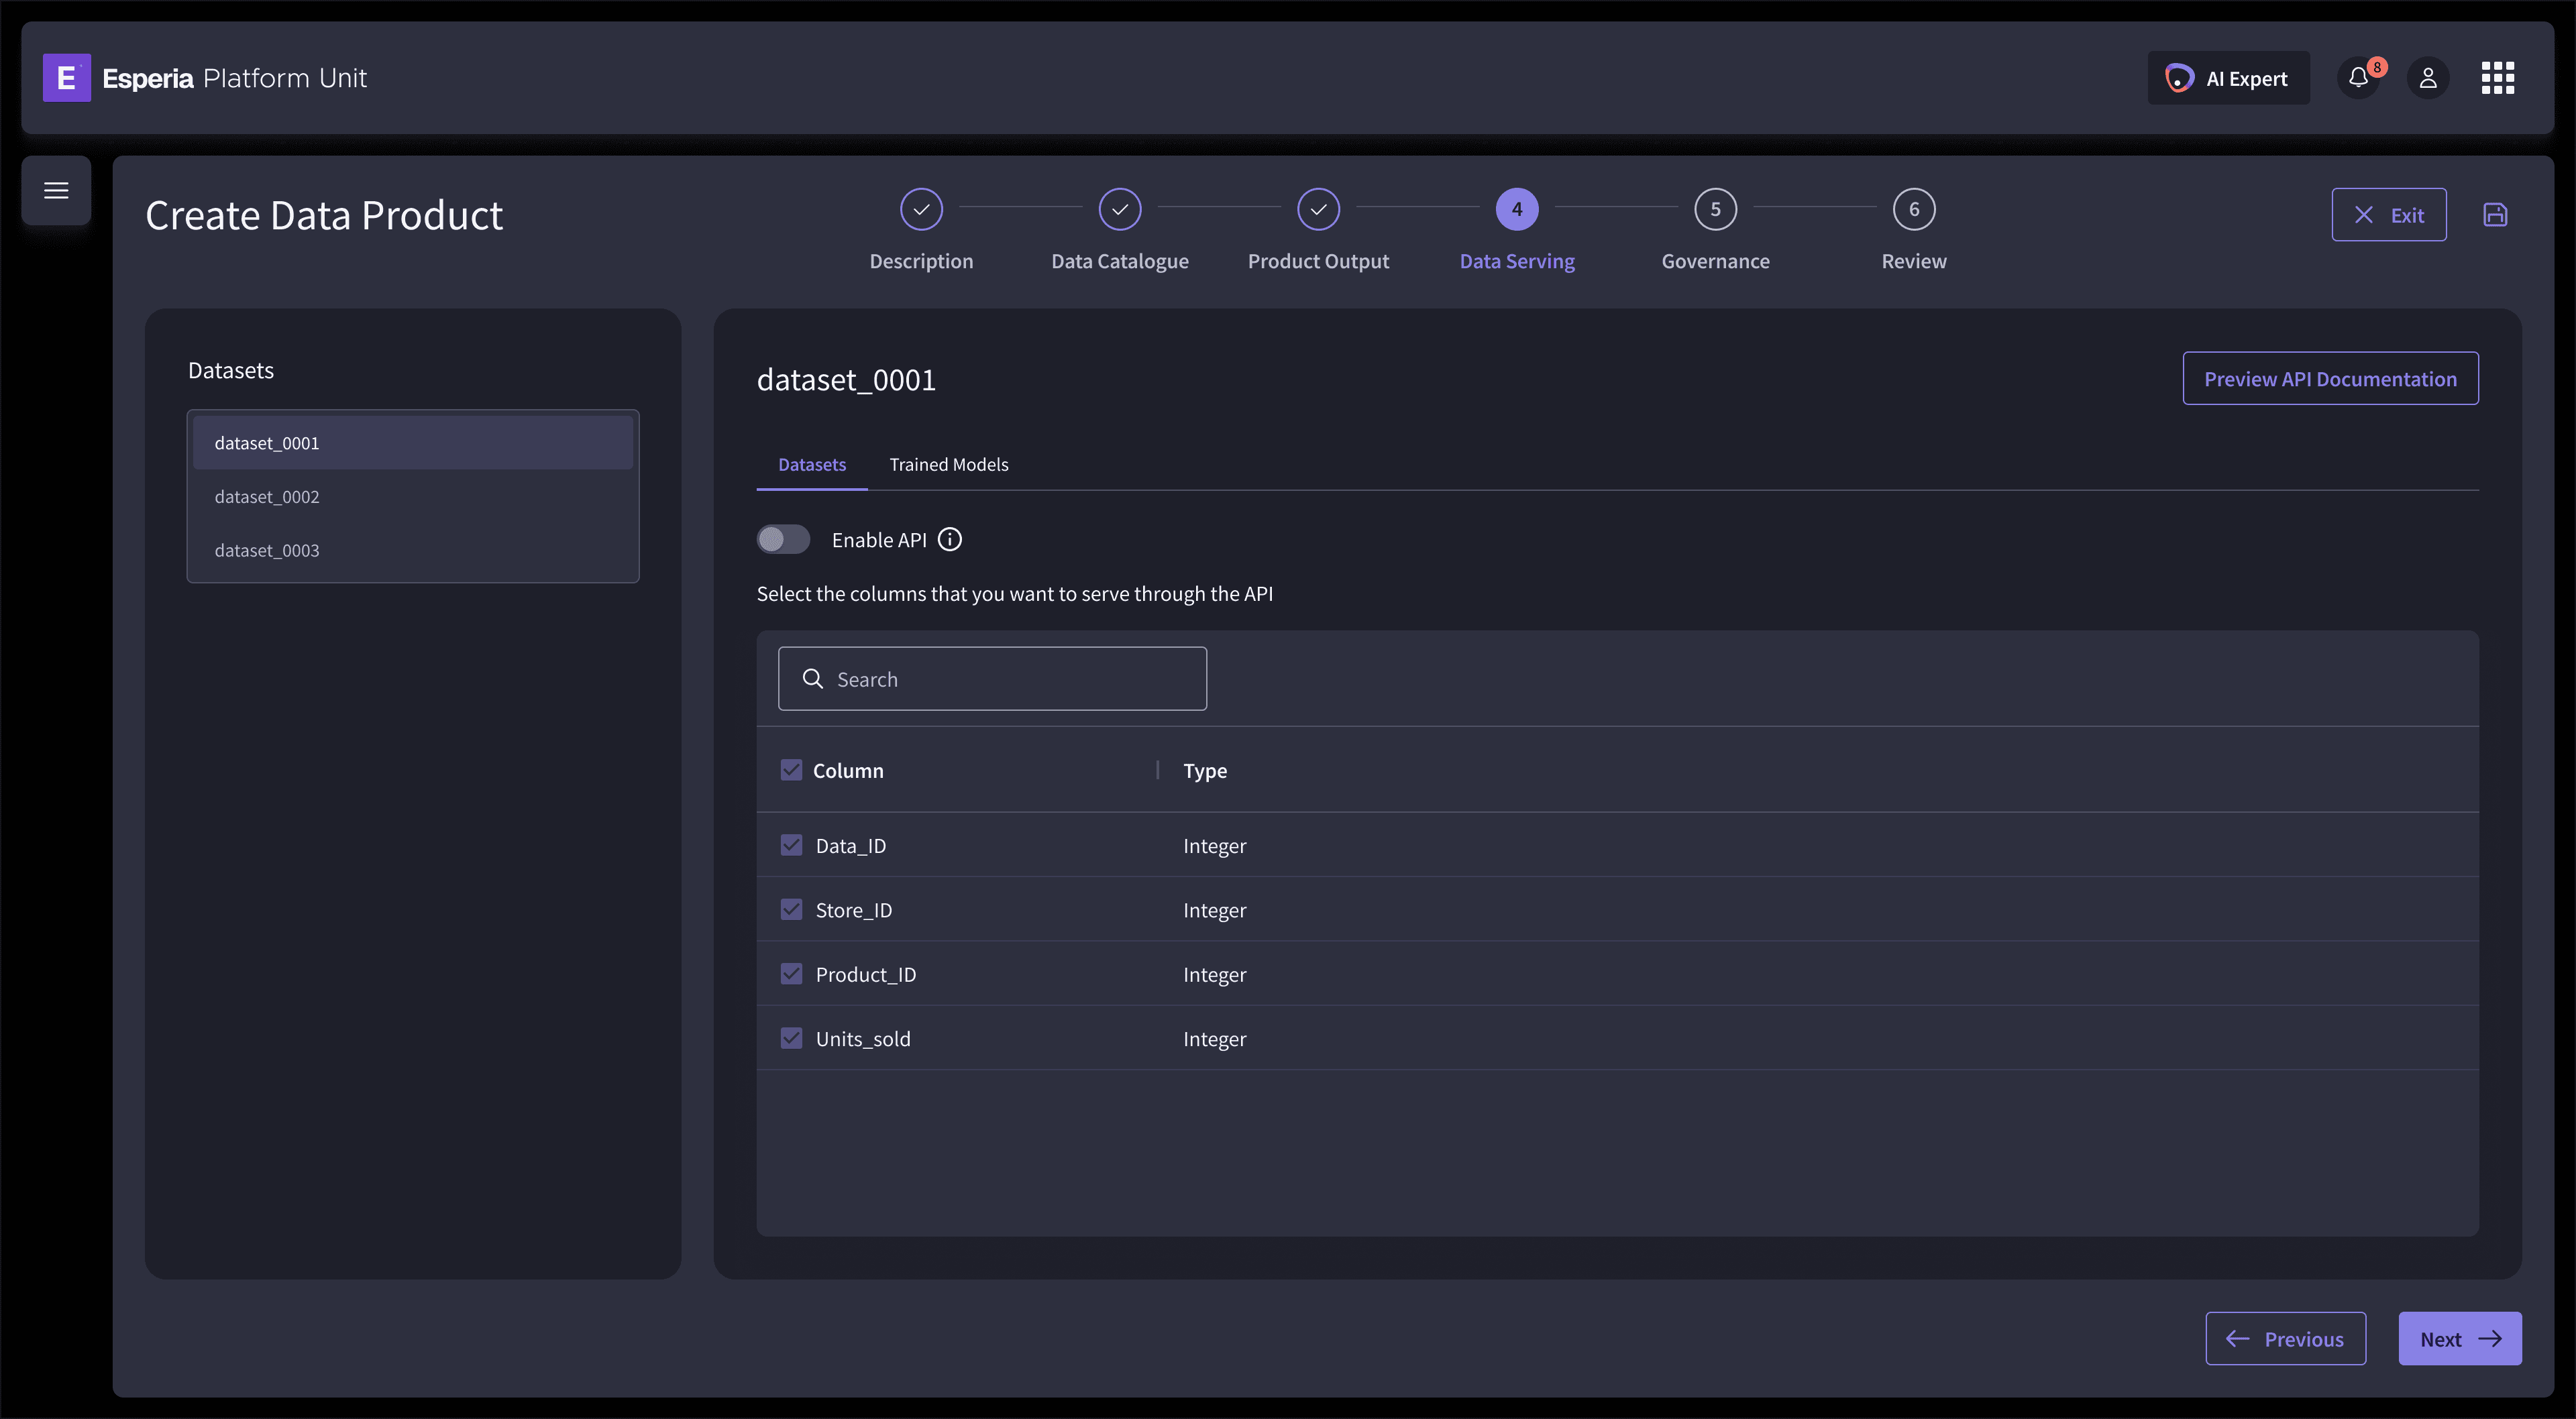
Column-Level API Serving

Enabled self-service API publishing for the first time, reducing engineering dependency while meeting enterprise security requirements through column-level access controls.

The column-level granularity satisfied security conscious enterprise IT requirements by giving explicit control over what data is exposed through the API surface.

Product Detail and Lineage Nodes

A centralised product dashboard provided visibility into ownership, outputs, adoption, and usage metrics for the first time. API consumption metrics, helping producers understand how their data products were being used.

The Dashboard, API Documentation shows product metadata, Product Outputs and the Statistics dat. These metrics turned the product detail page into an impact dashboard for the producer, something the platform had never offered before.

The Lineage graph, a interactive node graph showing the full data chain, Schema expandable panel with column names and types, and a configuration ID and a mini-map make large lineage chains navigable within the page. This is the most cited feature post launch.

DESIGN SYSTEM

Addition of Lineage Node

Each screen represents a core design decision, not just a layout choice, but a resolution to a specific user frustration or business goal.

Interactive lineage graph

I along with the PLM have introduced new node-graph component built for the system, zoomable, schema-expandable nodes that trace a product back through its transformations and source datasets, with edge-level upstream/downstream highlighting.

impact

Changes after Launch

Measured at 6 months post-launch on Esperia Platform Unit, across pilot enterprise clients

6% → 71%

Lineage coverage

18% → 83%

API serving rate

14 → 6

Steps to publish

11% → 58%

Consumer self-serve

−60%

Dev handoff time

4.4 / 5

CSAT score

Take Away

Honest Retrospective

‘’ I spend more time figuring out where the data lives than actually analysing it. It feels like archaeology, not analytics.’’


— VP Operations, Logistics enterprise client

uNEXPECTED FINDINGS

Lack of common creation workflow

Building a data product meant jumping across separate tools and 14 steps for dataset registration, dashboards, ML models, and API config. Each step was disconnected,

uNEXPECTED FINDINGS

AI was invisible to consumers

Non-technical stakeholders could view static dashboards but had no way to ask questions or get AI generated insights.

uNEXPECTED FINDINGS

Zero data lineage visibility

There was no way to trace a product back to its source datasets and transformations, engineers had no view into downstream usage.

uNEXPECTED FINDINGS

AI config was developer-only

Setting up a Knowledge Agent or Trained Model required engineering. Non-technical producers couldn't tune LLM parameters independently.

uNEXPECTED FINDINGS

Zero data lineage visibility

There was no way to trace a product back to its source datasets and transformations, engineers had no view into downstream usage.

uNEXPECTED FINDINGS

AI config was developer-only

Setting up a Knowledge Agent or Trained Model required engineering. Non-technical producers couldn't tune LLM parameters independently.

Back to events

Mobile Networking

Back to home

Esperia.

Introduction

Redesigned an enterprise data product with AI assistance, a unified platform that cut publishing time by 97%, enabled self serve 3x AI adoption, reduced support tickets by 68%, and improved documentation coverage from 6% to 71%.

Shipped

Lead Product Designer

4 months

Web - Enterprise SaaS

Security Platform

Project Overview

Esperia had spent four years building serious AI infrastructure, but data teams still operated across disconnected tools with no coherent layer tying the capabilities together. They lacked a unified workflow to create, configure, serve, and govern AI-powered data products leaving fragmented tooling, poor discoverability, and zero visibility into how data was consumed downstream.


The Approach

I designed the end-to-end UX for the AI Product Studio across 6 modules, built in a new component for the design system and AI interaction and embedded AI into the platform from sprint one, to a 6-step creation wizard, a persistent AI Expert chat, configurable Knowledge Agents, and interactive data lineage.

The outcome

All 6 product modules shipped on Esperia Platform ONE. AI chat adoption rose 3×, creation errors dropped 64%, and platform NPS climbed from +8 to +44 within six months.

6/6

Modules Shipped

↑3×

AI Chat Adoption

+44

Platform NPS

existing Research

Problems - Fill in the Gaps

‘’ I spend more time figuring out where the data lives than actually analysing it. It feels like archaeology, not analytics.’’


— VP Operations, Logistics enterprise client

01

Lack of common creation workflow

Building a data product meant jumping across separate tools and 14 steps for dataset registration, dashboards, ML models, and API config. Each step was disconnected,

02

AI was invisible to consumers

Non-technical stakeholders could view static dashboards but had no way to ask questions or get AI generated insights.

03

Zero data lineage visibility

There was no way to trace a product back to its source datasets and transformations, engineers had no view into downstream usage.

04

AI config was developer-only

Setting up a Knowledge Agent or Trained Model required engineering. Non-technical producers couldn't tune LLM parameters independently.

Constraints

These weren't preferences, they were hard constraints that shaped every major design decision. I documented all constraints in a shared "Design Brief" with assigned impact ratings before any wireframing began.


6 product modules, one design system - Every area built under a single component library with shared tokens and patterns.


Dev-ready output from day one - The Figma file structure mirrored the engineering squad structure, with no ambiguity in handoff.


Multi persona platform - Separate UX flows for Data Producer and Data Consumer, sharing one visual language.


AI configurability for non engineers - Knowledge Agent setup had to be comprehensible to data analysts, not just ML engineers.


API first serving - Every product configurable for API serving with column level control, no engineering required.


Interactive data lineage in the UI - Zoomable, schema-expandable, within a web platform.


Every AI response carries the mandatory accuracy disclaimer - A legal requirement on every AI surface.


Design Process

Every design decision traced back to a user interview, a usability test, or a platform metric. Four phases, Discovery to GA launch, shipped in 4 months.

01

PHASE 01 · DISCOVERY

User Research & Problem Framing

18 interviews with data producers and consumers, plus a legacy tooling audit, to map where trust broke down.

User Interviews

Heuristic Audit

Journey Mapping

Competitive Analysis

Support Tickets

02

PHASE 02 · DEFINITION

Information architecture & Navigation

Card sorting and tree testing (81% success) validated a 5-space IA so nothing was buried.

IA Design

Card Sorting

Tree Testing

User Flow Mapping

03

PHASE 03 · DESIGN & TEST

Design system, Iterative design + usability testing

Four rounds of moderated testing surfaced the AI-surface fires wizard length, persistent chat, exposed LLM controls.

High Fidelity Designs

Usability Testing

Iteration

04

PHASE 04 · SHIP & SCALE

Rollout across all modules

Three dev-review rounds and DEV-Ready docs. All 6 modules shipped, then two follow up iterations.

Dev Handoff

Accessibility

Key metrics evaluation

dISCOVERY

Research

Before designing, I synthesised existing signals from platform analytics, previous discovery sessions, and competitor analysis. This grounded design decisions rather than starting from intuition. Also used tools lIke JIRA, Whyser, Monday.com

18%

Data products with API serving

14 / 4 tools

Steps to publish (Legacy)

11%

Consumers attempting self-serve

6%

Products with lineage docs

+280% QoQ

“Can’t find dataset” tickets

+8

NPS (pre-redesign)

Understanding the User Group

18 user interviews across 3 personas - Data Producer, Data Consumer, Platform Admin at 6 enterprise clients spanning financial services, retail, logistics, and healthcare

THE BUILDER

Date Producer

Data analyst or engineer. Creates datasets, configures pipelines, trains models, builds dashboards. Needs a structured end to end creation flow that doesn't require jumping tools. Blocked by governance complexity, API setup.

The Stakeholder

Data Consumer

Business executive, product manager, operations lead. Views dashboards, wants to ask ad-hoc questions without waiting for analyst time. Needs: AI chat on dashboards, data freshness indicators, auto-generated reports.

The Operator

Platform Admin

Controls access, monitors consumption, manages governance policies. Needs lineage visibility, usage statistics (API tokens, interactions, consumer counts), and a clear data catalog with consistent metadata.

User Interview Findings

The user research team has conduct qualitative interviews to understand how people manage money and what prevents them from making better financial decisions.

Steep Technical Barrier

"I need to ask engineering for help every time. It takes 3 weeks just to get a simple data product created."

— Business Analyst

Time-Consuming Process

"It takes me 40+ hours to configure everything properly. Most of it is repetitive work that could be automated."

— Data Engineer

Configuration Complexity

"The UI has so many fields and options, I don't know where to start. I usually give up halfway through."

— Data Analyst

Error-Prone Workflows

"I make mistakes all the time and only find out after deployment. No validation or error prevention."

— Data Product Owner

Lack of Guidance

"There's no help when I get stuck. Documentation is technical and hard to understand."

— Product Manager

Limited Visibility

"I can't see the status of my data products or track usage. It's a black box after creation."

— Operations Manager

Heuristic Evaluation Findings

Evaluated the existing platform against Nielsen's 10 usability heuristics. Identified 47 issues across critical, high, medium, and low severity.

Critical

8 issues

Visibility of System Status

No progress indicators during data product creation. Users don't know if process is working or stuck.

Solution: Added step-by-step wizard with clear progress indicators and estimated time remaining for each phase.

Critical

6 issues

Error Prevention

No validation until final submission. Users make errors that only appear after 30+ minutes of configuration.

Solution: Implemented real-time validation with AI-powered error detection and prevention at each step.

High

12 issues

Help & Documentation

Documentation is technical and hard to find. No contextual help for complex fields.

Solution: Integrated AI Expert assistant providing contextual help, tooltips, and natural language guidance at every step.

High

9 issues

Recognition vs Recall

Users must remember complex configuration rules and field dependencies across multiple screens.

Solution: Smart field suggestions, auto-population based on context, and visual relationship indicators between fields.

Medium

8 issues

Aesthetic & Minimalist Design

Overwhelming amount of information and options displayed at once, causing cognitive overload.

Solution: Progressive disclosure pattern showing only relevant fields based on user selections and role.

Medium

4 issues

Consistency & Standards

Inconsistent terminology and UI patterns across different sections of the platform.

Solution: Developed unified design system with consistent components, language, and interaction patterns.

Competitive Analysis

Evaluated the existing platform against Nielsen's 10 usability heuristics. Identified 47 issues across critical, high, medium, and low severity.

definition

Information Architecture & Navigation

The full information architecture of Esperia Platform Unit — validated with card sorting and tree testing before any high-fidelity design began. Structure reflects how data flows, not how legacy tools were disconnected and lacked a cohesive workflow.

Esperia Platform Unit

Home

Platform Overview

Recent Products

Onboarding Checklist

AI Expert Chat

Data Products

LIST — All Products

CREATE — 6-step Wizard

DETAIL — Overview

DETAIL — Dashboard

DETAIL — API Docs

DELETE — Confirm

AI Expert Chat

Lineage Graph

Pipelines

LIST — Pipelines

CREATE — Pipeline

DETAIL — Status

Integrations Catalog

Integration Config

Sync Scheduling

DELETE

Transforms

LIST — All

CREATE — SQL/dbt

DETAIL — Run status

Dependency Tree

Version History

Output Preview

DELETE

Data Catalog

LIST — Browse

Search + Filter

DETAIL — Schema

Column Metadata

Dataset Tags

Freshness Status

Lineage Preview

Changes from Tree Testing

Validated the information architecture with 45 participants using tree testing to ensure users could find key features intuitively.


Merged "Pipelines" and "Integrations" into one space - Users consistently looked for them together.


Moved Knowledge Agents under Data Products rather than a top-level item — only ML personas expected it standalone.


Renamed governance labels to plain language after 40% mis-sorted the legacy terms.


Promoted Data Catalog to a primary space after low findability scores in round one.


Kept AI Expert global (top bar) — every persona expected it persistently available, not nested.


Solutions

Decisions on the Screen

Each screen represents a core design decision, not just a layout choice, but a resolution to a specific user frustration or business goal.

6 Steps, Split panel with contextual AI attachment

A split view interface combined the dashboard canvas with a contextual panel for widgets, trained models and AI chat, surfacing key model details without leaving the workflow. Reduced data product creation time by 60%,

Guided workflow with 6 steppers breaking complex data product creation into digestible steps with clear progress indicators showing completion status.

Producers could switch between Dashboard and API outputs from the same screen, replacing a fragmented 7 step process.

Persistent AI Expert Chat Panel

Always visible AI panel (not a drawer) drove 3× higher adoption than the hiddenpanel prototype. Contextual to the dashboard dataset.

Inline Widget and Trained Models panel eliminated a separate model attachment flow.

Knowledge Agent config with Live preview

Complex LLM settings were translated into guided controls with real-time preview, making AI configuration accessible to non technical users. API toggle and Public Access toggle give producers instant control over serving scope.

Large Language Model (LLM) parameters each with plain language guidance eliminated the top support ticket category post launch.

Live preview panel lets producers test before publishing with no engineering required.

Also provides suggested starter prompts to help and validate.

Column-Level API Serving

Enabled self-service API publishing for the first time, reducing engineering dependency while meeting enterprise security requirements through column-level access controls.

The column-level granularity satisfied security conscious enterprise IT requirements by giving explicit control over what data is exposed through the API surface.

Product Detail and Lineage Nodes

A centralised product dashboard provided visibility into ownership, outputs, adoption, and usage metrics for the first time. API consumption metrics, helping producers understand how their data products were being used.

The Dashboard, API Documentation shows product metadata, Product Outputs and the Statistics dat. These metrics turned the product detail page into an impact dashboard for the producer, something the platform had never offered before.

The Lineage graph, a interactive node graph showing the full data chain, Schema expandable panel with column names and types, and a configuration ID and a mini-map make large lineage chains navigable within the page. This is the most cited feature post launch.

DESIGN SYSTEM

Addition of Lineage Node

Each screen represents a core design decision, not just a layout choice, but a resolution to a specific user frustration or business goal.

Interactive lineage graph

I along with the PLM have introduced new node-graph component built for the system, zoomable, schema-expandable nodes that trace a product back through its transformations and source datasets, with edge-level upstream/downstream highlighting.

impact

Changes after Launch

Measured at 6 months post-launch on Esperia Platform Unit, across pilot enterprise clients

6% → 71%

Lineage coverage

18% → 83%

API serving rate

14 → 6

Steps to publish

11% → 58%

Consumer self-serve

−60%

Dev handoff time

4.4 / 5

CSAT score

Take Away

Honest Retrospective

‘’ I spend more time figuring out where the data lives than actually analysing it. It feels like archaeology, not analytics.’’


— VP Operations, Logistics enterprise client

uNEXPECTED FINDINGS

Lack of common creation workflow

Building a data product meant jumping across separate tools and 14 steps for dataset registration, dashboards, ML models, and API config. Each step was disconnected,

uNEXPECTED FINDINGS

AI was invisible to consumers

Non-technical stakeholders could view static dashboards but had no way to ask questions or get AI generated insights.

uNEXPECTED FINDINGS

Zero data lineage visibility

There was no way to trace a product back to its source datasets and transformations, engineers had no view into downstream usage.

uNEXPECTED FINDINGS

AI config was developer-only

Setting up a Knowledge Agent or Trained Model required engineering. Non-technical producers couldn't tune LLM parameters independently.

uNEXPECTED FINDINGS

Zero data lineage visibility

There was no way to trace a product back to its source datasets and transformations, engineers had no view into downstream usage.

uNEXPECTED FINDINGS

AI config was developer-only

Setting up a Knowledge Agent or Trained Model required engineering. Non-technical producers couldn't tune LLM parameters independently.

Back to events

Mobile Networking

Back to home

Esperia.

Introduction

Redesigned an enterprise data product with AI assistance, a unified platform that cut publishing time by 97%, enabled self serve 3x AI adoption, reduced support tickets by 68%, and improved documentation coverage from 6% to 71%.

Shipped

Lead Product Designer

4 months

Web - Enterprise SaaS

Security Platform

Project Overview

Esperia had spent four years building serious AI infrastructure, but data teams still operated across disconnected tools with no coherent layer tying the capabilities together. They lacked a unified workflow to create, configure, serve, and govern AI-powered data products leaving fragmented tooling, poor discoverability, and zero visibility into how data was consumed downstream.


The Approach

I designed the end-to-end UX for the AI Product Studio across 6 modules, built in a new component for the design system and AI interaction and embedded AI into the platform from sprint one, to a 6-step creation wizard, a persistent AI Expert chat, configurable Knowledge Agents, and interactive data lineage.

The outcome

All 6 product modules shipped on Esperia Platform ONE. AI chat adoption rose 3×, creation errors dropped 64%, and platform NPS climbed from +8 to +44 within six months.

6/6

Modules Shipped

↑3×

AI Chat Adoption

+44

Platform NPS

existing Research

Problems - Fill in the Gaps

‘’ I spend more time figuring out where the data lives than actually analysing it. It feels like archaeology, not analytics.’’


— VP Operations, Logistics enterprise client

01

Lack of common creation workflow

Building a data product meant jumping across separate tools and 14 steps for dataset registration, dashboards, ML models, and API config. Each step was disconnected,

02

AI was invisible to consumers

Non-technical stakeholders could view static dashboards but had no way to ask questions or get AI generated insights.

03

Zero data lineage visibility

There was no way to trace a product back to its source datasets and transformations, engineers had no view into downstream usage.

04

AI config was developer-only

Setting up a Knowledge Agent or Trained Model required engineering. Non-technical producers couldn't tune LLM parameters independently.

Constraints

These weren't preferences, they were hard constraints that shaped every major design decision. I documented all constraints in a shared "Design Brief" with assigned impact ratings before any wireframing began.


6 product modules, one design system - Every area built under a single component library with shared tokens and patterns.


Dev-ready output from day one - The Figma file structure mirrored the engineering squad structure, with no ambiguity in handoff.


Multi persona platform - Separate UX flows for Data Producer and Data Consumer, sharing one visual language.


AI configurability for non engineers - Knowledge Agent setup had to be comprehensible to data analysts, not just ML engineers.


API first serving - Every product configurable for API serving with column level control, no engineering required.


Interactive data lineage in the UI - Zoomable, schema-expandable, within a web platform.


Every AI response carries the mandatory accuracy disclaimer - A legal requirement on every AI surface.


Design Process

Every design decision traced back to a user interview, a usability test, or a platform metric. Four phases, Discovery to GA launch, shipped in 4 months.

01

PHASE 01 · DISCOVERY

User Research & Problem Framing

18 interviews with data producers and consumers, plus a legacy tooling audit, to map where trust broke down.

User Interviews

Heuristic Audit

Journey Mapping

Competitive Analysis

Support Tickets

02

PHASE 02 · DEFINITION

Information architecture & Navigation

Card sorting and tree testing (81% success) validated a 5-space IA so nothing was buried.

IA Design

Card Sorting

Tree Testing

User Flow Mapping

03

PHASE 03 · DESIGN & TEST

Design system, Iterative design + usability testing

Four rounds of moderated testing surfaced the AI-surface fires wizard length, persistent chat, exposed LLM controls.

High Fidelity Designs

Usability Testing

Iteration

04

PHASE 04 · SHIP & SCALE

Rollout across all modules

Three dev-review rounds and DEV-Ready docs. All 6 modules shipped, then two follow up iterations.

Dev Handoff

Accessibility

Key metrics evaluation

dISCOVERY

Research

Before designing, I synthesised existing signals from platform analytics, previous discovery sessions, and competitor analysis. This grounded design decisions rather than starting from intuition. Also used tools lIke JIRA, Whyser, Monday.com

18%

Data products with API serving

14 / 4 tools

Steps to publish (Legacy)

11%

Consumers attempting self-serve

6%

Products with lineage docs

+280% QoQ

“Can’t find dataset” tickets

+8

NPS (pre-redesign)

Understanding the User Group

18 user interviews across 3 personas - Data Producer, Data Consumer, Platform Admin at 6 enterprise clients spanning financial services, retail, logistics, and healthcare

THE BUILDER

Date Producer

Data analyst or engineer. Creates datasets, configures pipelines, trains models, builds dashboards. Needs a structured end to end creation flow that doesn't require jumping tools. Blocked by governance complexity, API setup.

The Stakeholder

Data Consumer

Business executive, product manager, operations lead. Views dashboards, wants to ask ad-hoc questions without waiting for analyst time. Needs: AI chat on dashboards, data freshness indicators, auto-generated reports.

The Operator

Platform Admin

Controls access, monitors consumption, manages governance policies. Needs lineage visibility, usage statistics (API tokens, interactions, consumer counts), and a clear data catalog with consistent metadata.

User Interview Findings

The user research team has conduct qualitative interviews to understand how people manage money and what prevents them from making better financial decisions.

Steep Technical Barrier

"I need to ask engineering for help every time. It takes 3 weeks just to get a simple data product created."

— Business Analyst

Time-Consuming Process

"It takes me 40+ hours to configure everything properly. Most of it is repetitive work that could be automated."

— Data Engineer

Configuration Complexity

"The UI has so many fields and options, I don't know where to start. I usually give up halfway through."

— Data Analyst

Error-Prone Workflows

"I make mistakes all the time and only find out after deployment. No validation or error prevention."

— Data Product Owner

Lack of Guidance

"There's no help when I get stuck. Documentation is technical and hard to understand."

— Product Manager

Limited Visibility

"I can't see the status of my data products or track usage. It's a black box after creation."

— Operations Manager

Heuristic Evaluation Findings

Evaluated the existing platform against Nielsen's 10 usability heuristics. Identified 47 issues across critical, high, medium, and low severity.

Critical

8 issues

Visibility of System Status

No progress indicators during data product creation. Users don't know if process is working or stuck.

Solution: Added step-by-step wizard with clear progress indicators and estimated time remaining for each phase.

Critical

6 issues

Error Prevention

No validation until final submission. Users make errors that only appear after 30+ minutes of configuration.

Solution: Implemented real-time validation with AI-powered error detection and prevention at each step.

High

12 issues

Help & Documentation

Documentation is technical and hard to find. No contextual help for complex fields.

Solution: Integrated AI Expert assistant providing contextual help, tooltips, and natural language guidance at every step.

High

9 issues

Recognition vs Recall

Users must remember complex configuration rules and field dependencies across multiple screens.

Solution: Smart field suggestions, auto-population based on context, and visual relationship indicators between fields.

Medium

8 issues

Aesthetic & Minimalist Design

Overwhelming amount of information and options displayed at once, causing cognitive overload.

Solution: Progressive disclosure pattern showing only relevant fields based on user selections and role.

Medium

4 issues

Consistency & Standards

Inconsistent terminology and UI patterns across different sections of the platform.

Solution: Developed unified design system with consistent components, language, and interaction patterns.

Competitive Analysis

Evaluated the existing platform against Nielsen's 10 usability heuristics. Identified 47 issues across critical, high, medium, and low severity.

definition

Information Architecture & Navigation

The full information architecture of Esperia Platform Unit — validated with card sorting and tree testing before any high-fidelity design began. Structure reflects how data flows, not how legacy tools were disconnected and lacked a cohesive workflow.

Esperia Platform Unit

Home

Platform Overview

Recent Products

Onboarding Checklist

AI Expert Chat

Data Products

LIST — All Products

CREATE — 6-step Wizard

DETAIL — Overview

DETAIL — Dashboard

DETAIL — API Docs

DELETE — Confirm

AI Expert Chat

Lineage Graph

Pipelines

LIST — Pipelines

CREATE — Pipeline

DETAIL — Status

Integrations Catalog

Integration Config

Sync Scheduling

DELETE

Transforms

LIST — All

CREATE — SQL/dbt

DETAIL — Run status

Dependency Tree

Version History

Output Preview

DELETE

Data Catalog

LIST — Browse

Search + Filter

DETAIL — Schema

Column Metadata

Dataset Tags

Freshness Status

Lineage Preview

Changes from Tree Testing

Validated the information architecture with 45 participants using tree testing to ensure users could find key features intuitively.


Merged "Pipelines" and "Integrations" into one space - Users consistently looked for them together.


Moved Knowledge Agents under Data Products rather than a top-level item — only ML personas expected it standalone.


Renamed governance labels to plain language after 40% mis-sorted the legacy terms.


Promoted Data Catalog to a primary space after low findability scores in round one.


Kept AI Expert global (top bar) — every persona expected it persistently available, not nested.


Solutions

Decisions on the Screen

Each screen represents a core design decision, not just a layout choice, but a resolution to a specific user frustration or business goal.

6 Steps, Split panel with contextual AI attachment

A split view interface combined the dashboard canvas with a contextual panel for widgets, trained models and AI chat, surfacing key model details without leaving the workflow. Reduced data product creation time by 60%,

Guided workflow with 6 steppers breaking complex data product creation into digestible steps with clear progress indicators showing completion status.

Producers could switch between Dashboard and API outputs from the same screen, replacing a fragmented 7 step process.

Persistent AI Expert Chat Panel

Always visible AI panel (not a drawer) drove 3× higher adoption than the hiddenpanel prototype. Contextual to the dashboard dataset.

Inline Widget and Trained Models panel eliminated a separate model attachment flow.

Knowledge Agent config with Live preview

Complex LLM settings were translated into guided controls with real-time preview, making AI configuration accessible to non technical users. API toggle and Public Access toggle give producers instant control over serving scope.

Large Language Model (LLM) parameters each with plain language guidance eliminated the top support ticket category post launch.

Live preview panel lets producers test before publishing with no engineering required.

Also provides suggested starter prompts to help and validate.

Column-Level API Serving

Enabled self-service API publishing for the first time, reducing engineering dependency while meeting enterprise security requirements through column-level access controls.

The column-level granularity satisfied security conscious enterprise IT requirements by giving explicit control over what data is exposed through the API surface.

Product Detail and Lineage Nodes

A centralised product dashboard provided visibility into ownership, outputs, adoption, and usage metrics for the first time. API consumption metrics, helping producers understand how their data products were being used.

The Dashboard, API Documentation shows product metadata, Product Outputs and the Statistics dat. These metrics turned the product detail page into an impact dashboard for the producer, something the platform had never offered before.

The Lineage graph, a interactive node graph showing the full data chain, Schema expandable panel with column names and types, and a configuration ID and a mini-map make large lineage chains navigable within the page. This is the most cited feature post launch.

DESIGN SYSTEM

Addition of Lineage Node

Each screen represents a core design decision, not just a layout choice, but a resolution to a specific user frustration or business goal.

Interactive lineage graph

I along with the PLM have introduced new node-graph component built for the system, zoomable, schema-expandable nodes that trace a product back through its transformations and source datasets, with edge-level upstream/downstream highlighting.

impact

Changes after Launch

Measured at 6 months post-launch on Esperia Platform Unit, across pilot enterprise clients

6% → 71%

Lineage coverage

18% → 83%

API serving rate

14 → 6

Steps to publish

11% → 58%

Consumer self-serve

−60%

Dev handoff time

4.4 / 5

CSAT score

Take Away

Honest Retrospective

‘’ I spend more time figuring out where the data lives than actually analysing it. It feels like archaeology, not analytics.’’


— VP Operations, Logistics enterprise client

uNEXPECTED FINDINGS

Lack of common creation workflow

Building a data product meant jumping across separate tools and 14 steps for dataset registration, dashboards, ML models, and API config. Each step was disconnected,

uNEXPECTED FINDINGS

AI was invisible to consumers

Non-technical stakeholders could view static dashboards but had no way to ask questions or get AI generated insights.

uNEXPECTED FINDINGS

Zero data lineage visibility

There was no way to trace a product back to its source datasets and transformations, engineers had no view into downstream usage.

uNEXPECTED FINDINGS

AI config was developer-only

Setting up a Knowledge Agent or Trained Model required engineering. Non-technical producers couldn't tune LLM parameters independently.

uNEXPECTED FINDINGS

Zero data lineage visibility

There was no way to trace a product back to its source datasets and transformations, engineers had no view into downstream usage.

uNEXPECTED FINDINGS

AI config was developer-only

Setting up a Knowledge Agent or Trained Model required engineering. Non-technical producers couldn't tune LLM parameters independently.